
In an attempt to broaden the scope (and lower the barrier) to 3D capabilities, one of the things we’ve been thinking about is how to support users that want to explore the possibilities of 3D, AR, and VR, but do not have access to 3D models. There were some obvious initial things to support…
1) Create a library of sample 3D Models
We created a set of stock 3D models for common items. (Big shoutout to Technical Artist, Ronnie Ashlock who created our library). You can find the full asset library on GitHub.
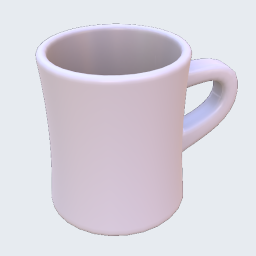
Coffee Mug 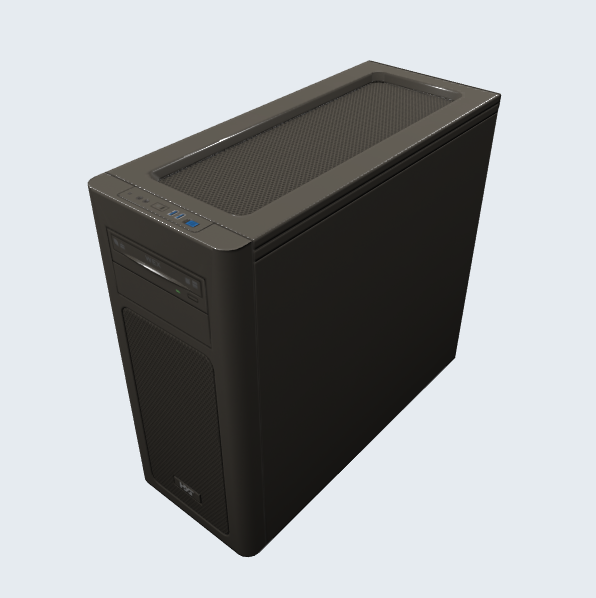
Computer Case 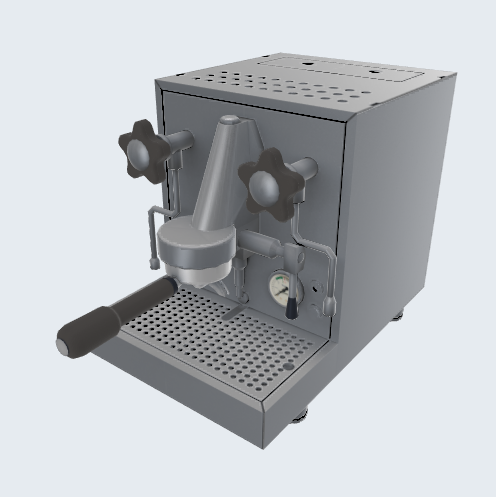
Espresso Machine
2) Support 2D Content (Images, Movies, PDFs)
Next, we ensured our 3D capabilities would work with with 2D content. For example, you can place a 2D image in a 3D space.

3) Provide Simple 3D Creation Tools
The next step was to provide simple 3D shape creation tools. Not only could you manually define a cube, cylinder, sphere, etc. But more impressively, you can trace out a shape in Augmented Reality.
4) Link to existing 3D model archives
The next obvious step was to support linking to existing 3D model archives like Google’s Poly for simplistic models or CG Trader for more professional models. The advantage of these two asset libraries is that they both have their own REST APIs and support GLTF/GLB files.
5) Explore Data Visualization
At the same time, I was intrigued by the idea of converting existing data (for example, an Excel spreadsheet), into a 3D models.
To test this, I built an Azure Function (basically, this is just a stateless program running on a remote server that you can interact with via HTTP/REST calls).
The function requires Input in the form of 2D array and the output is a GLB file. Optional input includes the grid size, output height, and a range of RGB values.
I used the Babylon.JS Sandbox to test the results of my returned GLB files. And a couple assumptions I used for this proof-of-concept:
- The resultant GLB is forced into a 1×1 meter square.
- Surface Normals are calculated from adjacent Verticies
I was pretty happy with the result. In this video you can see I built a PowerApp to choose between five different data sets. I can then adjust the input values, send the data via a REST call to the Azure Function. The resultant GLB can be previewed in-app but can also be viewed in Augmented Reality (Mobile AR).